

Big Board Orientation Guide
Introduction
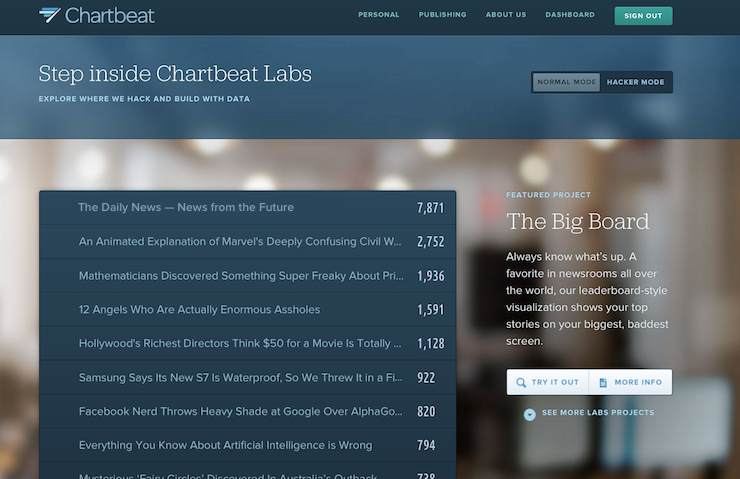
Born out of our Chartbeat Labs projects, bringing the Big Board to your newsroom screens adds enhances the presence of data in your workflow. Whereas the power of the Dashboard lies in its ability to pivot on a user’s specific needs, the Big Board shows the entire newsroom which stories are succeeding at capturing and keeping your audience’s attention.
Installation
Installation is simple—after logging into Chartbeat, head to chartbeat.com/labs and select the "Try It" button below the Big Board. Then select the domain you want to see and the Big Board will open in a separate browser window.
Configurations
In the top right-hand corner is the configure button, which gives you full control over how you want to customize the big board data. The top half is dedicated to dropdowns—menus for applying filters to your data, similar to pivoting in the Dashboard. Toggles are located in the bottom half, letting you enable or disable different features.
Drop-Down Filters
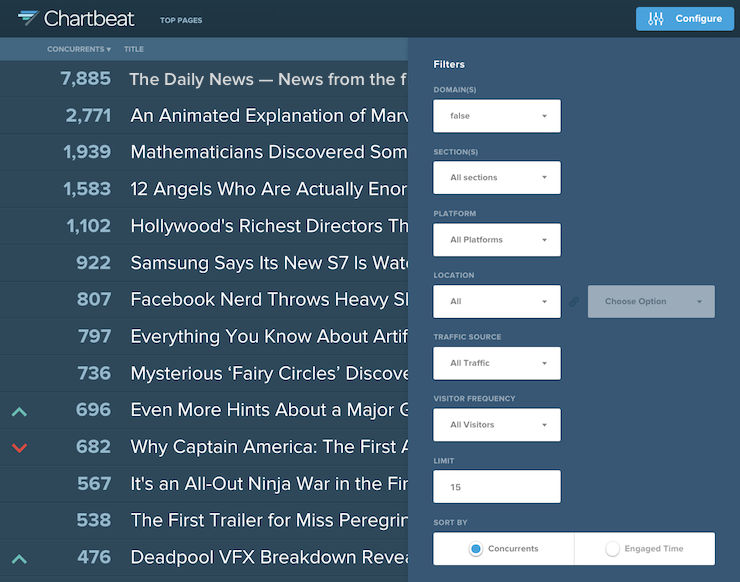
- Domains: select any number of domains that you have access to and see them rolled up into a single Big Board. You’ll even see a square logo automatically load for each so you can tell them apart.
- Section: apply a section filter to the top pages to see content just from that particular section.
- Platform: filter the top pages by either desktop, tablet, or mobile and see how content is performing across various device types.
- Location: Select a specific country or city you want to filter on and see how your content is reaching a regional audience.
- Visitor Frequency: Select new, returning, or loyal visitors to see how your content correlates with different audience groups.
- Limit: limit the number of top pages shown in the ranking; set to 15 by default but you can set it up to 50.
- Sort By: toggles the ranking of top pages from concurrents to engaged time, so you can see which articles are doing the best job at holding readers’ attention.
Toggles
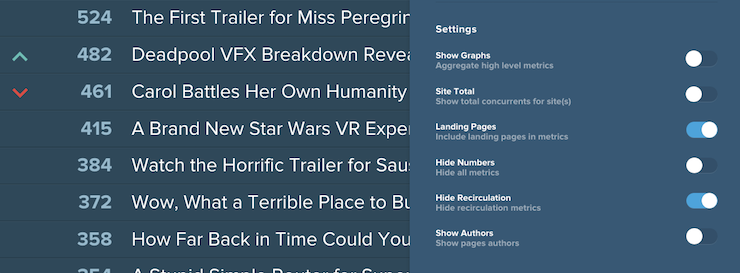
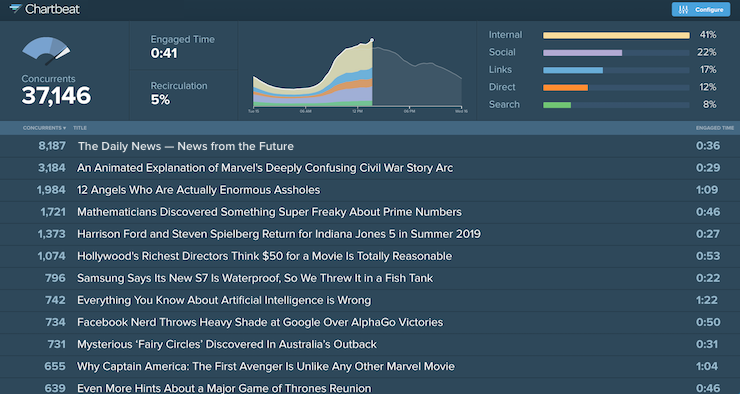
- Show Graphs: Displays the three main Chartbeat metrics, traffic sources, as well as the concurrents graph at the top of the Big Board. Use it to get a fuller picture of your audience at a quick glance.
- Site Total: Show total concurrents for site(s): Displays the total number of concurrents on across your domain (or collection of domains), even if you’ve applied a specific filter.
- Landing Pages: Landing pages are included by default but can be hidden from view so you’re only looking at your article pages.
- Hide Numbers: Hides all the metric numbers from the screen, perfect if you want to share your big board outside the company but don’t want to expose your actual numbers.
- Hide Recirculation: Hidden by default, you can opt to display the recirculation percentage on the right-hand side, next to Engaged Time.
- Show Authors: Shows article authors beneath titles if you’ve implemented the author variable.
Chartcorps Insight: Want to see how our partners use their Big Board? Check out how CNBC International, USA Today, and CNN Money incorporate Big Board into their newsrooms.